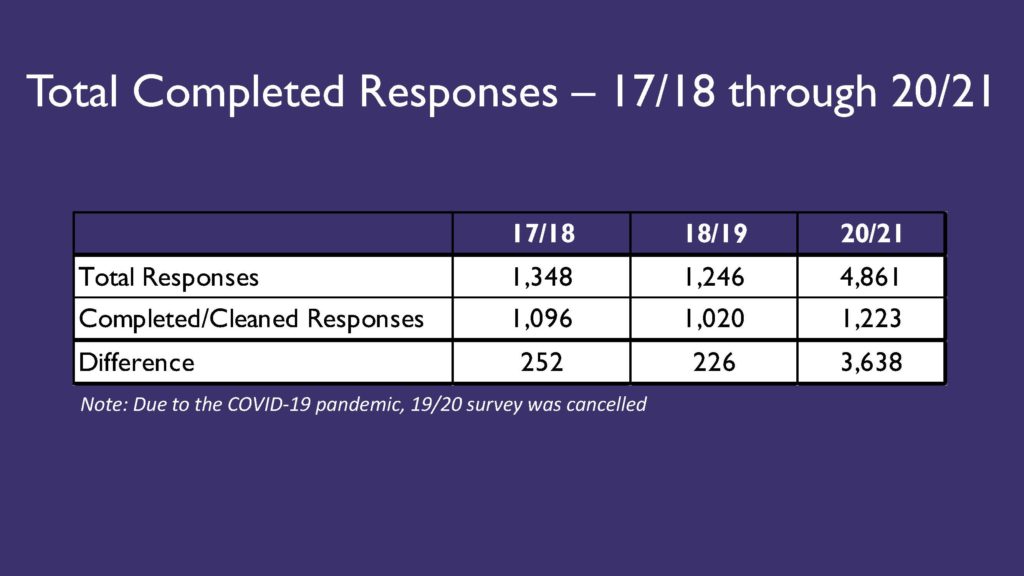
• The timing and social circumstances of the COVID pandemic led DLBA to cancel the 19/20 survey. The initial 19/20 response rate was abnormally low and the perception of safety and health would be outlier data.
• The 20/21 survey was open from mid-April to the end of May, and we received almost 4 times the number of results. After cleaning data, the response amount is more congruous with past years. City shared the link on their Twitter.
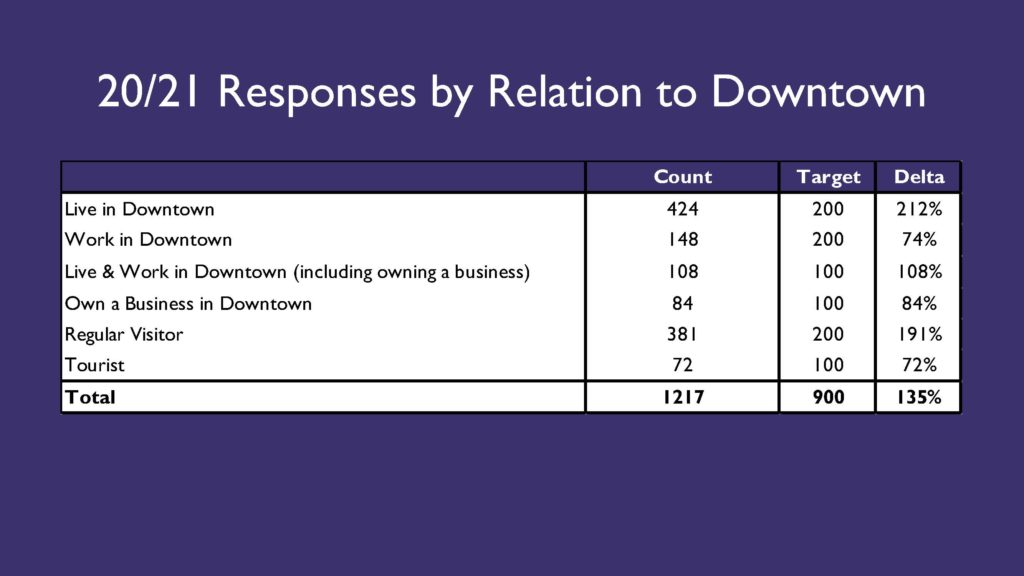
• The largest number of responses came from Downtown Residents or Regular Visitors, followed by Downtown Workers and Live/Workers. There was still underreporting from Workers, Business Owners, and Tourists. The distribution of the survey went beyond DTLB, hence large numbers of area visitors.
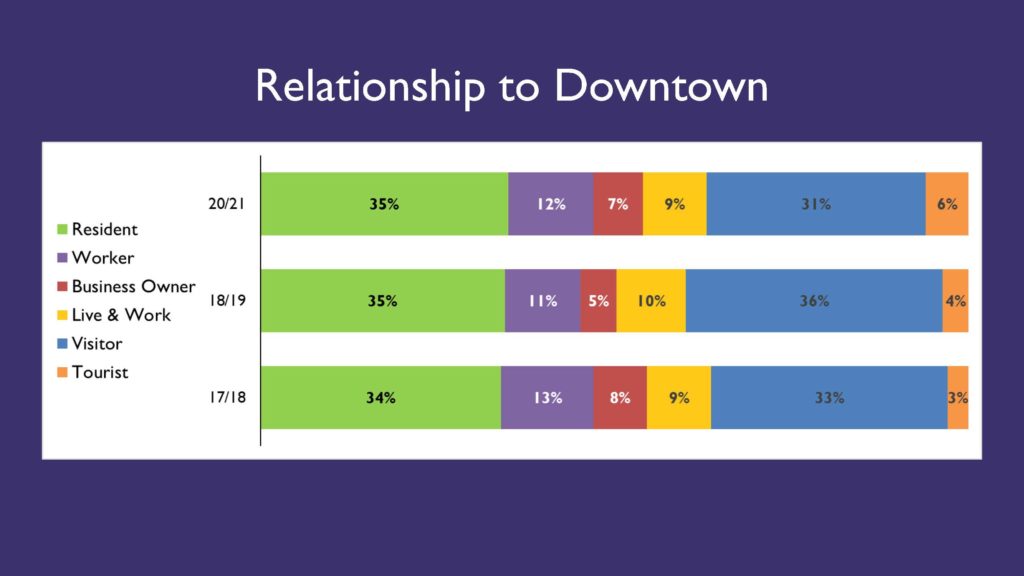
• The breakdown of Downtown user type is roughly the same over the past three iterations of the survey.
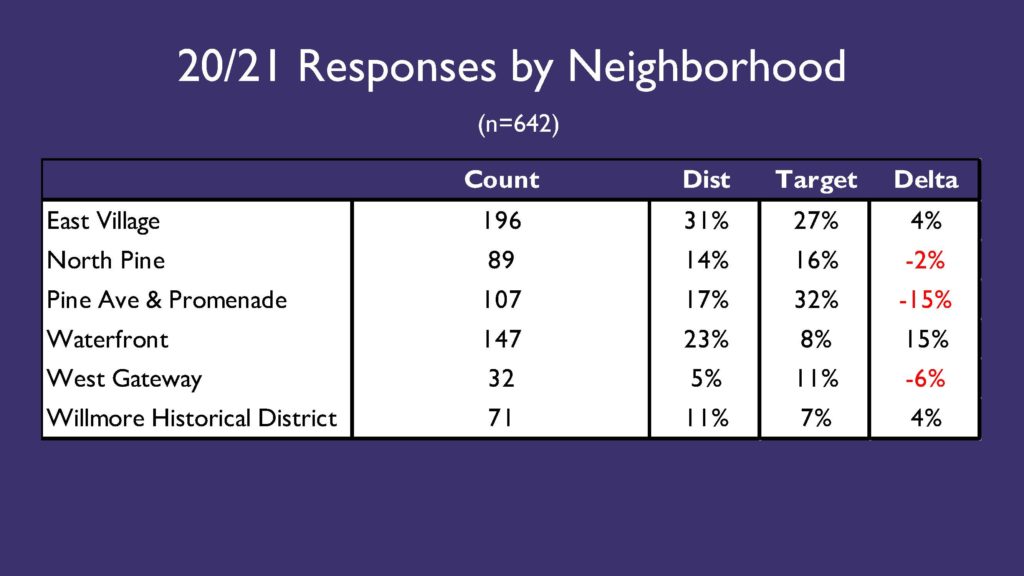
• There is underreporting from Pine/Promenade residents and the West Gateway area, and overreporting from the Waterfront and slightly from East Village. Overreporting from the Waterfront is to be expected from older, retired, and more civically involved residents. The target distribution is based off of census tract data.
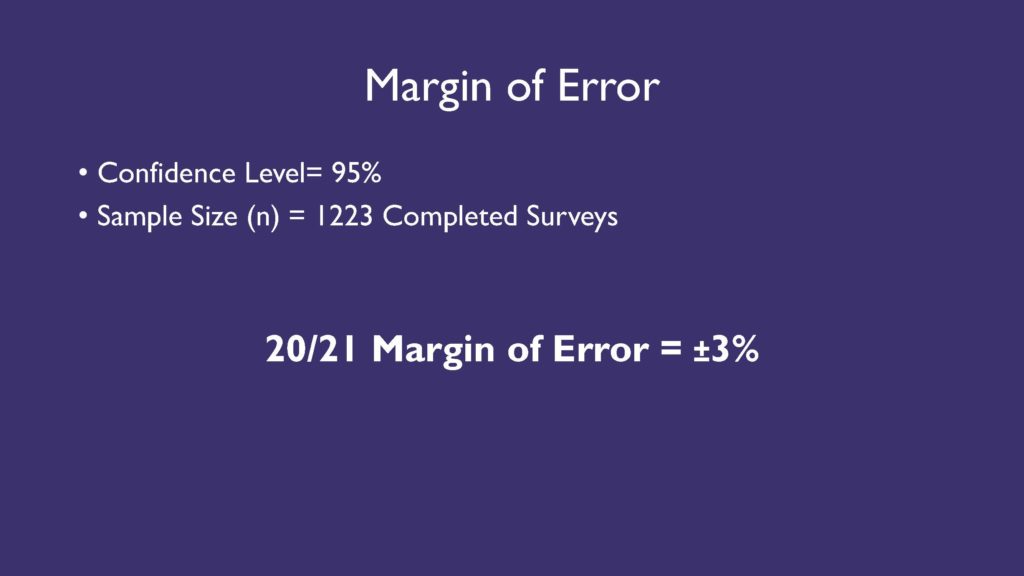
• Margin of error is calculated based upon the number of results we received, the total downtown population, and the confidence interval in the reliability of the results.
• Margin of error has been the same the past three years of the survey.
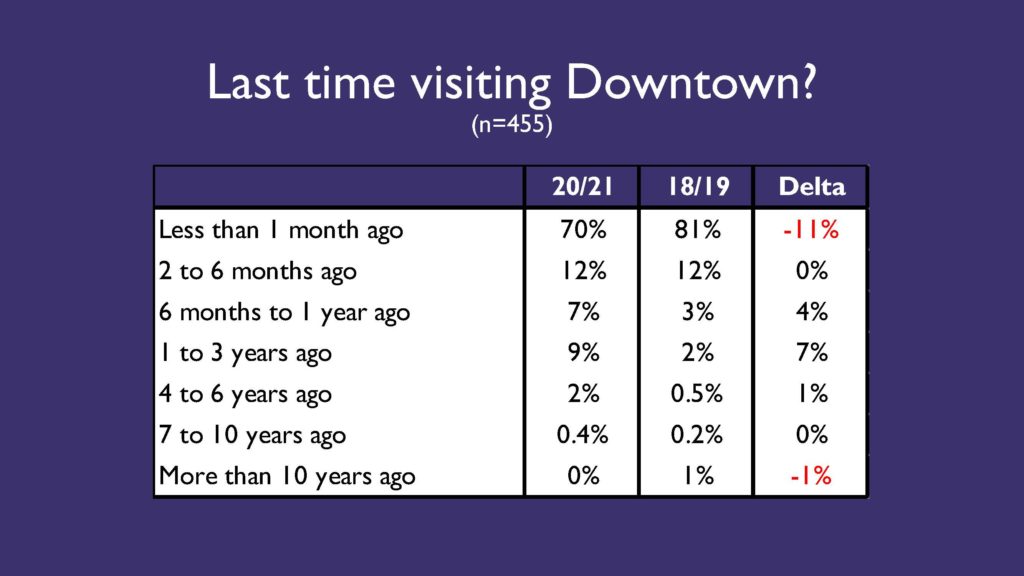
• This question was only added starting in 2018/19, but it’s interesting to see how frequent visits to DTLB have declined compared to the previous survey. This is possibly due to COVID-related restrictions.
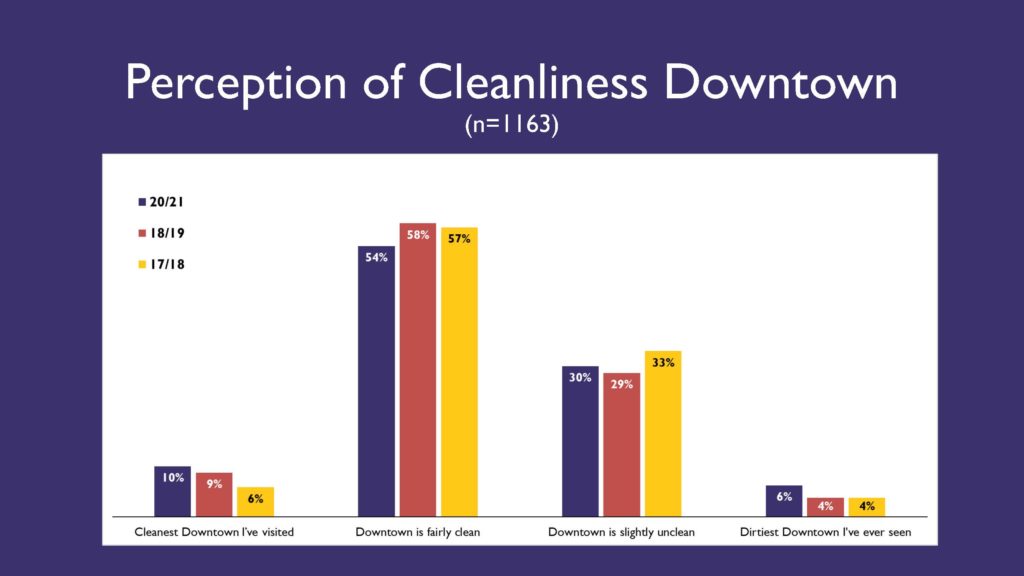
• The perception of cleanliness has stayed roughly the same over the past three years with most people saying that downtown is “fairly clean”.
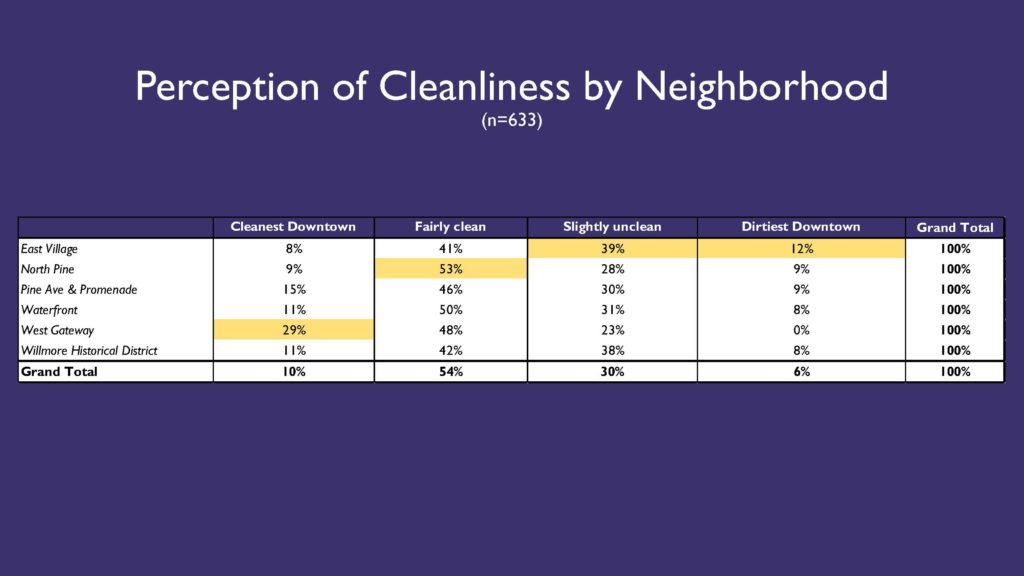
• Selected cross tab: the perception of cleanliness broken down by DTLB neighborhoods.
• The highlighted cells represent which neighborhood has the highest proportion of responses in each cleanliness category. West Gateway was the largest share of “cleanest downtown” responses, North Pine for “fairly clean”, and East Village for both “slightly unclean” and “dirtiest downtown” categories.
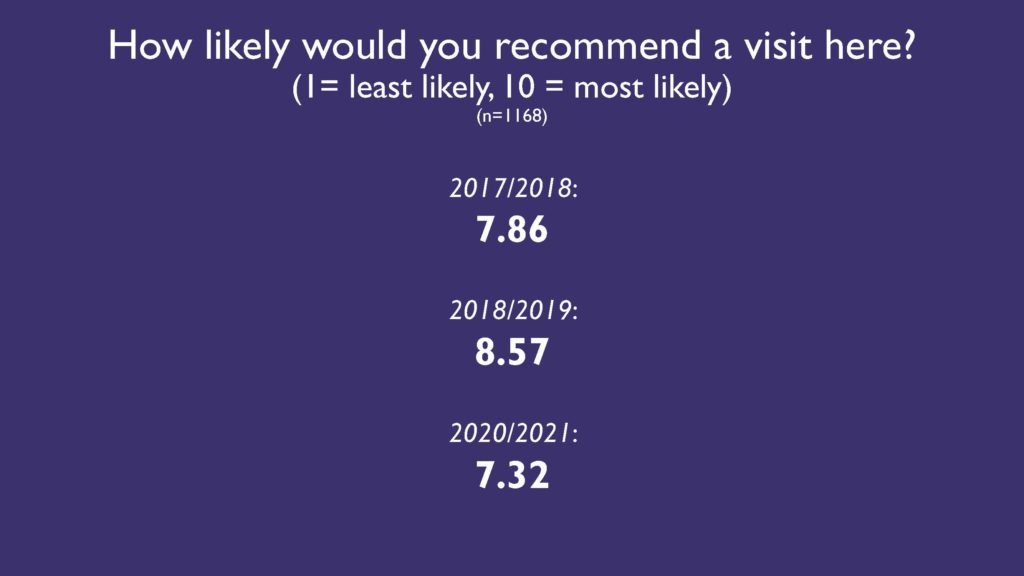
• The recommendation rating score has decreased from the past three years.
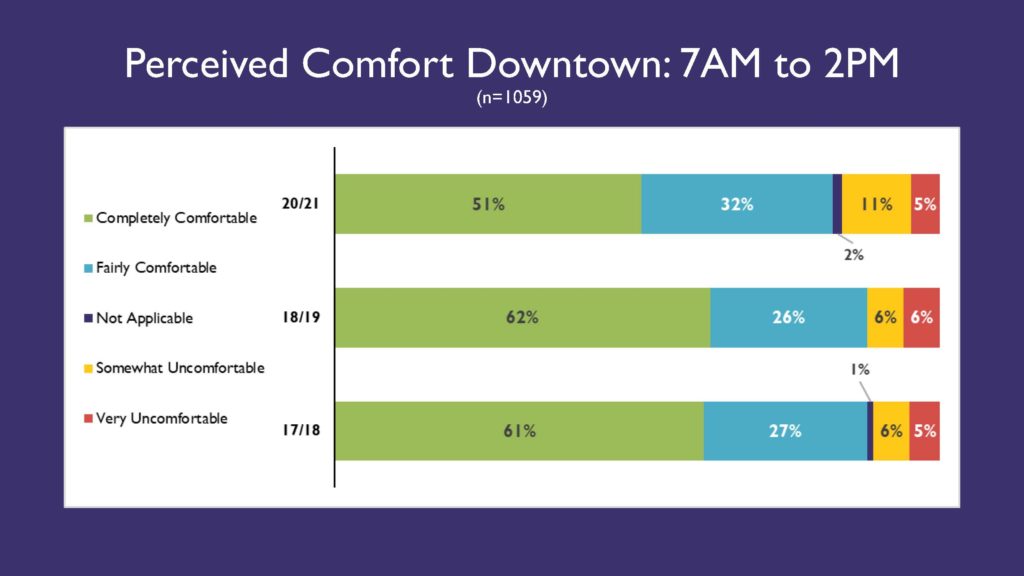
• Perceived comfort at 7am – 2pm, working hours.
• The share of “completely comfortable” as well as overall comfortability has decreased.
• People who reported “somewhat uncomfortable” have doubled during this time of day.
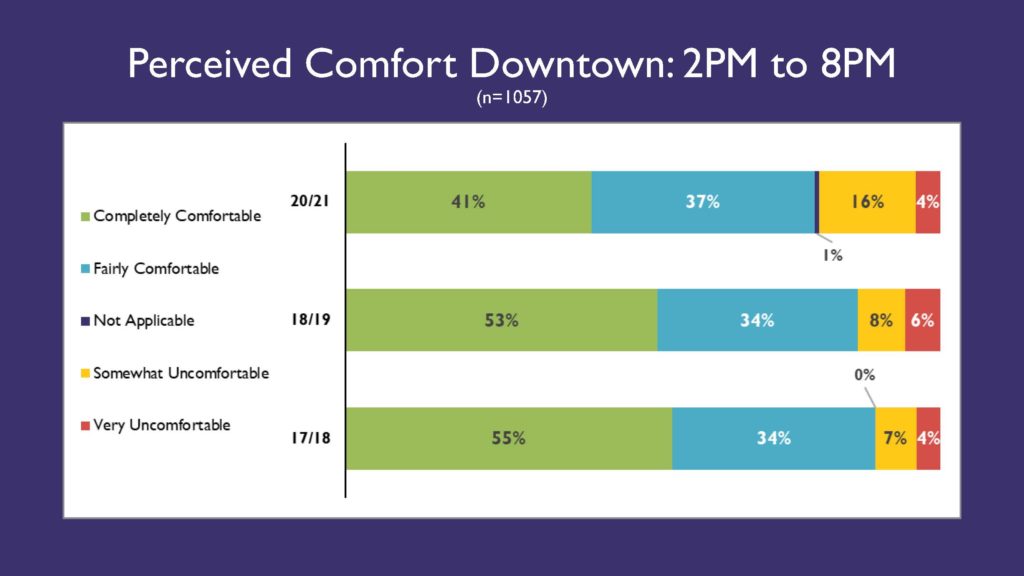
• 2pm to 8pm
• People who reported feeling “somewhat uncomfortable” has doubled since 18/19.
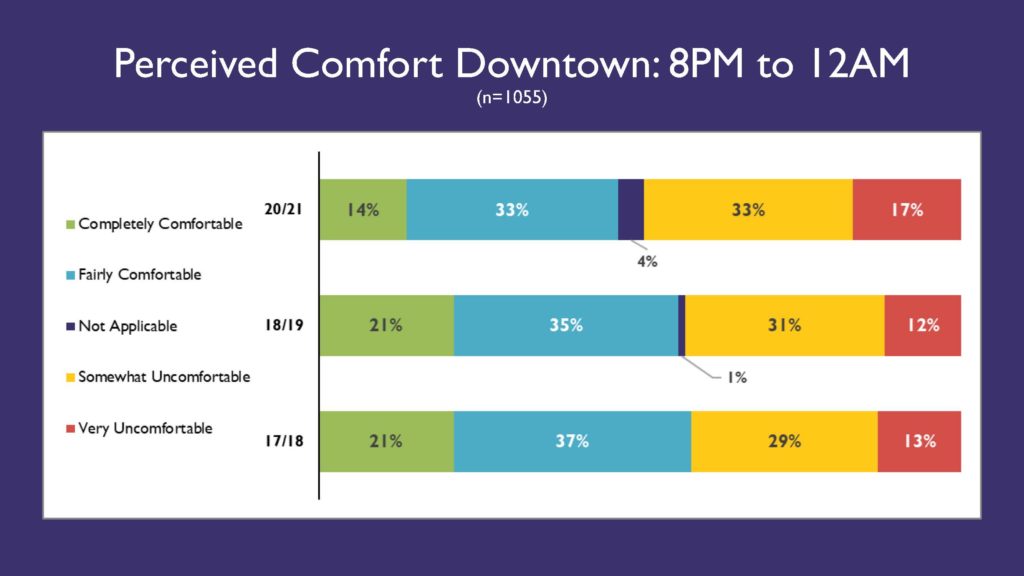
• 8pm to 12am, Dinner/Nightlife hours.
• Comfortability has decreased, “N/A” has increased (possibly because less people visiting at this timeframe), and the share of overall those feeling uncomfortable has increased.
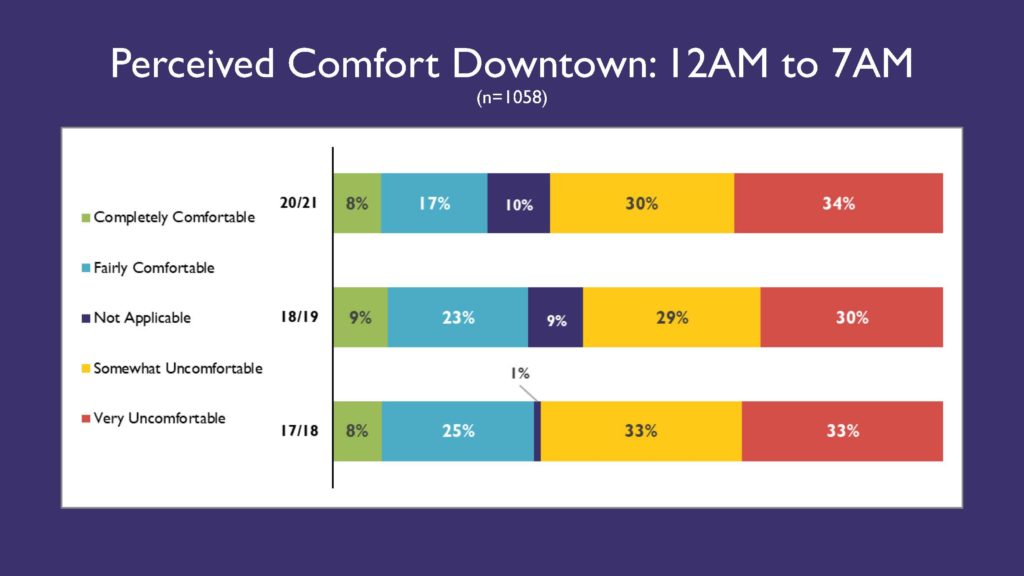
• 12am to 7am
• Levels of discomfort are back to 17/18 levels, and “N/A” responses increased as well.
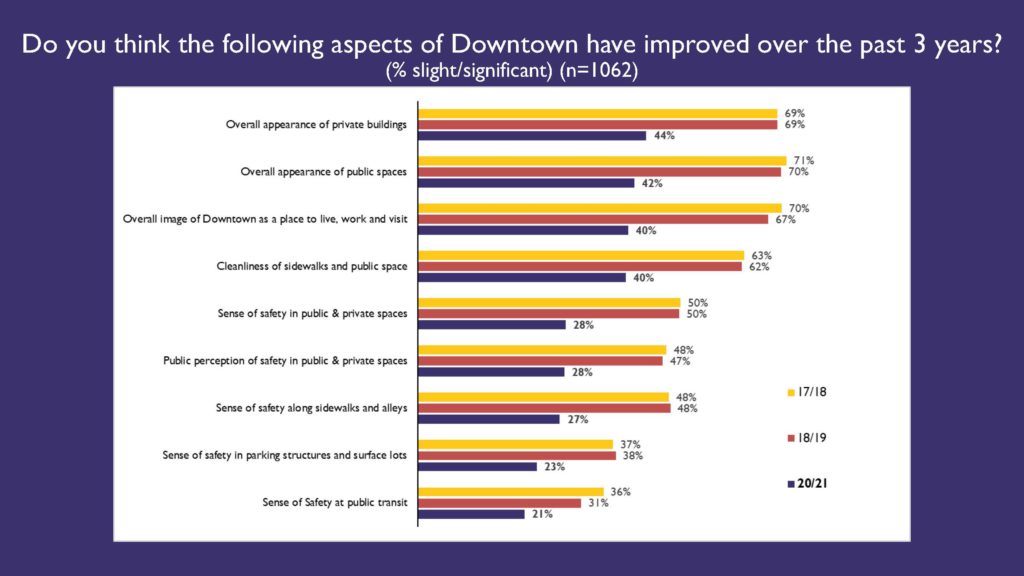
• Large decrease in perception that the following aspects of Downtown have improved over past 3 years. This doesn’t necessarily mean thing have gotten correspondingly worse, but just not improved since 17/18. “Momentum” has decreased.
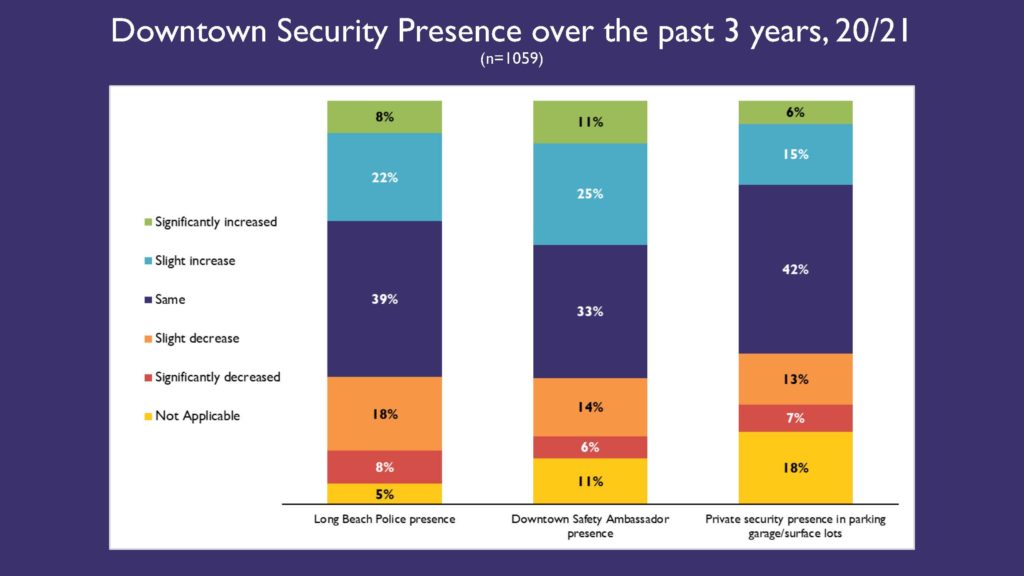
• Can’t really compare to past years because the question changed from better/worse presence to increase/decrease presence. The previous option was open to too much subjective interpretation.
• For the most part people said security presence stayed the same, with about 20% saying there was an increase in all categories.
• Police had the largest perceived decrease in presence.
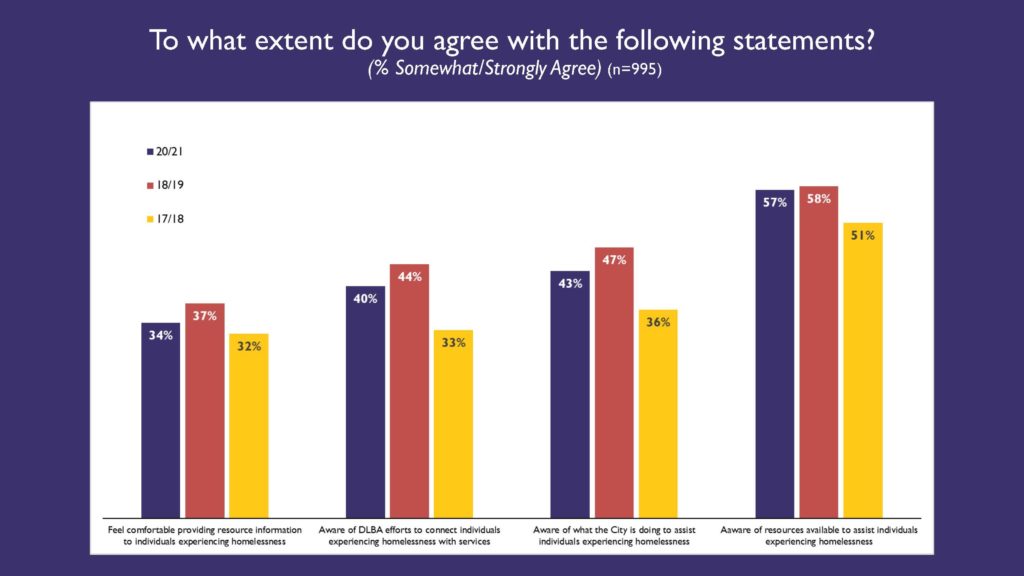
• Sentiment questions on homelessness.
• Numbers are roughly the same as 18/19, with 30-40% agreeing on knowledge of DLBA/city efforts.
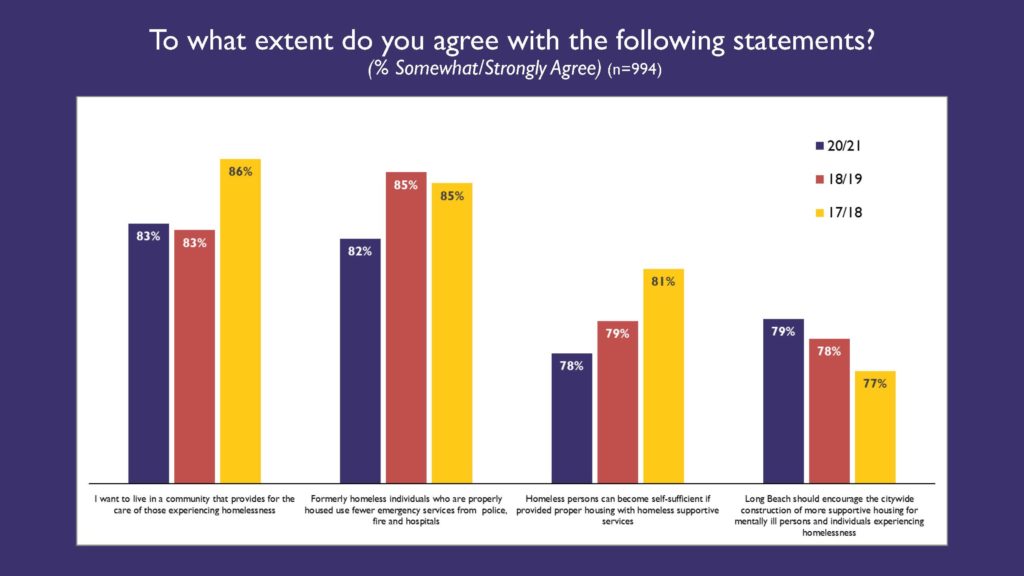
• Small fluctuations from one year to the next, but agreement numbers are in high 70s low 80s.
• These sentiment questions are biased.
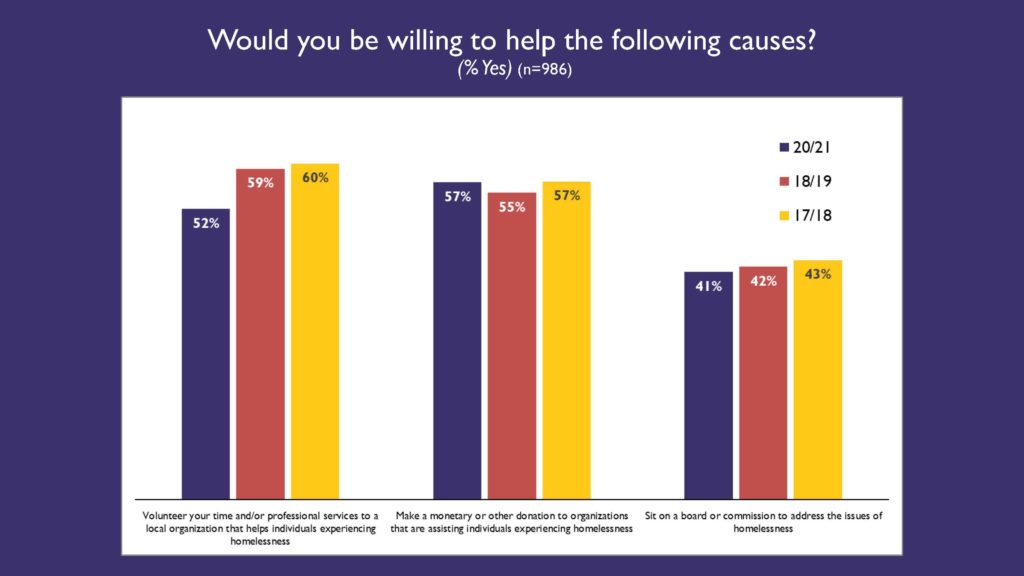
• Same as the previous slide (slide 18), but numbers hover around 50%.
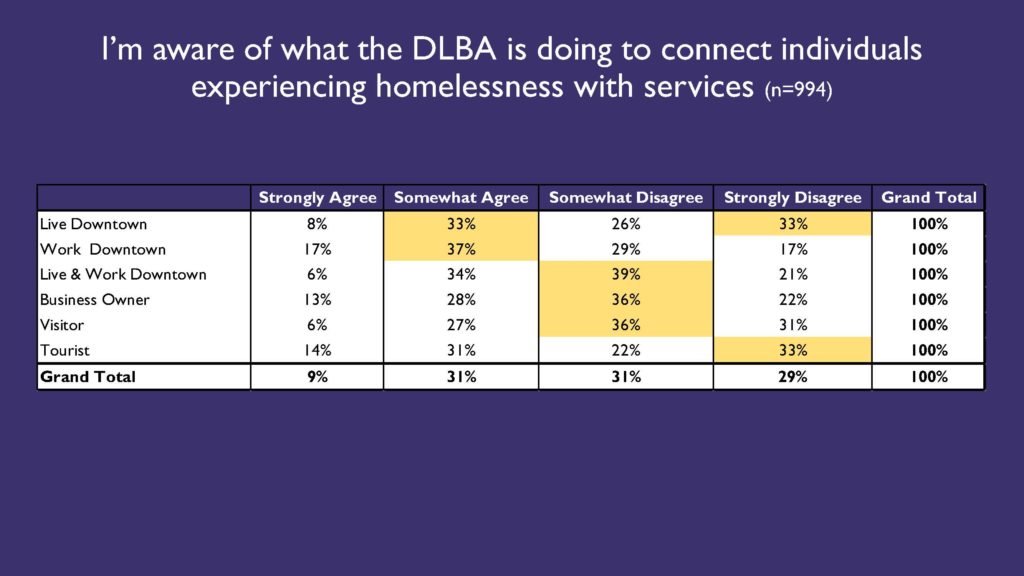
• Crosstab of sentiment knowledge on DLBA homelessness efforts by user type
• Highlighted cells represent the largest response group from each row of Downtown user type.
• While Residents and Workers have the largest share agreement for homeless services, the majority of answers from other user groups are in disagreement for knowledge of homeless services.
• Most users aren’t really aware of what DLBA does for those experiencing homelessness, although it has increased over the past three years.
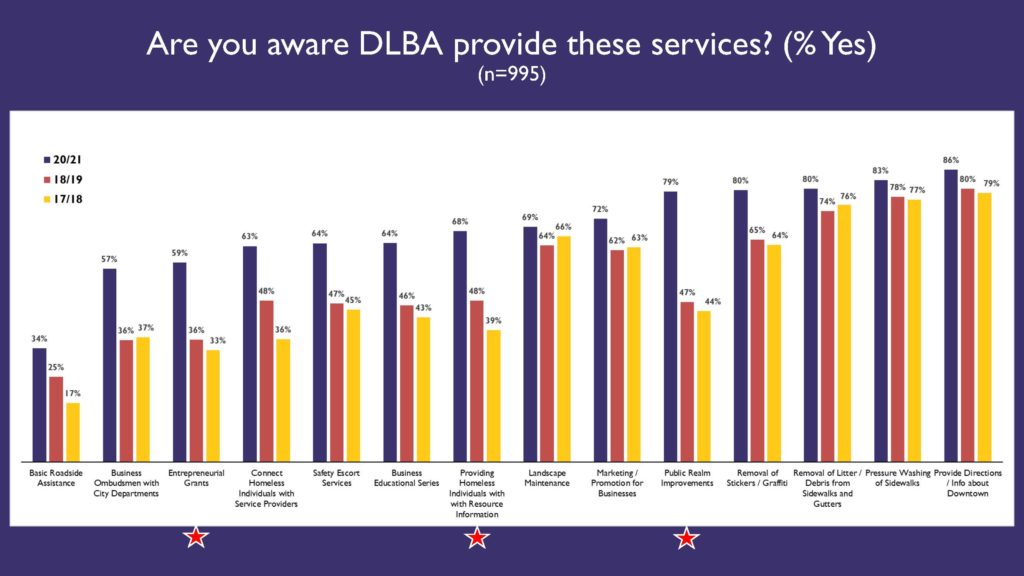
• Awareness of all DLBA services has increased about 15-20% on avg over the past 3 years
• Increased outreach and messaging over last year.
• Grants, homeless services, and public realm are the biggest increases.
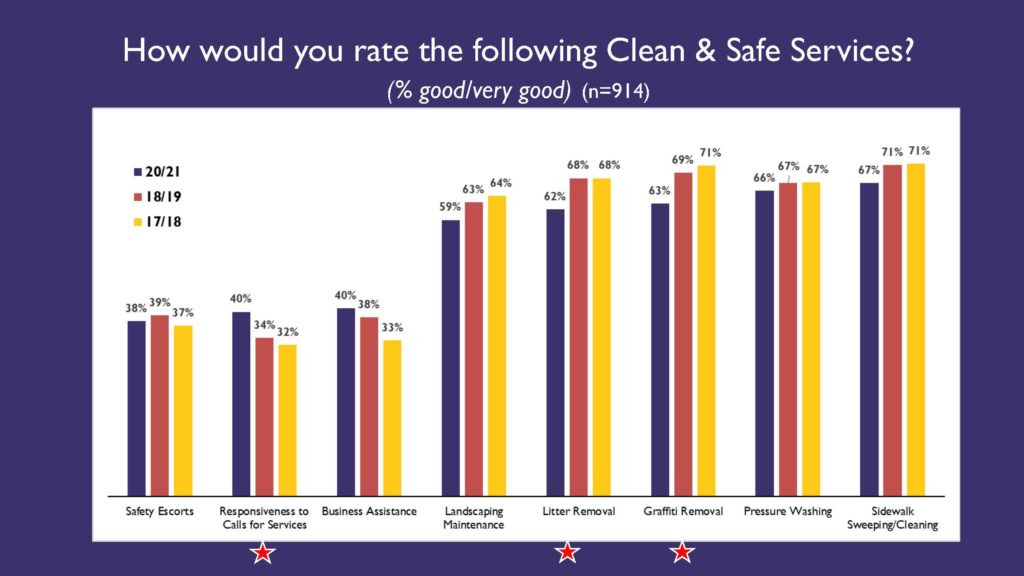
• The rating of specific clean safe services decreased slightly, but on trend.
• Responsiveness increased the most but is still around 40% good.
• Litter and graffiti removal had the biggest decrease, but still 2/3s say it’s good.
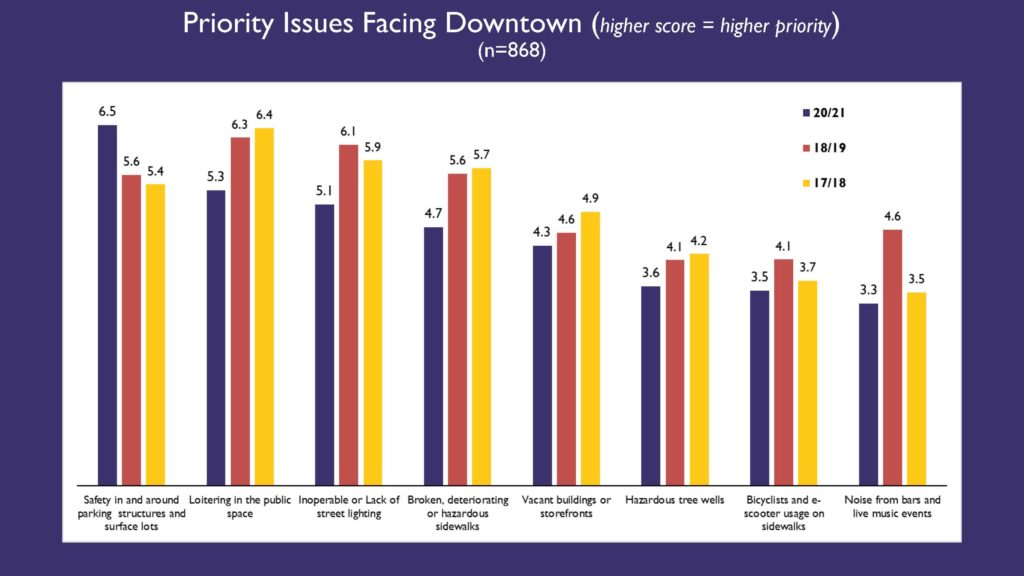
• Parking and Surface lot safety has increased in priority, almost tied with loitering in public space in last years. Issue may have been elevated due to decrease in street activity over past year, more underused spaces and generally less eyes on the street. Similar for street lighting issue.
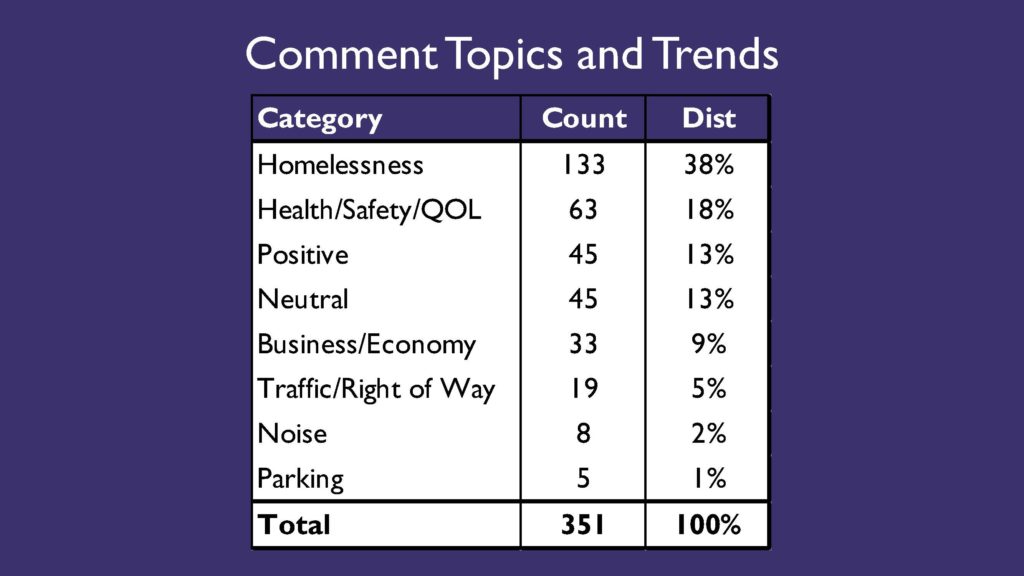
• 2 out 5 comments were about homelessness, 1 out of 5 was about health and safety (animal waste, litter, property crime, etc.).
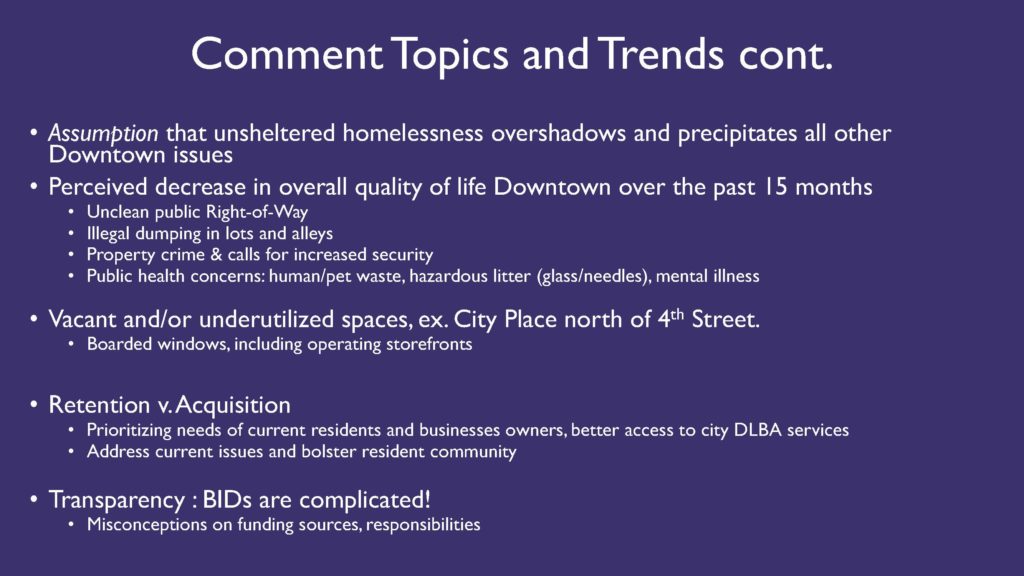
• Summarized themes of comments.
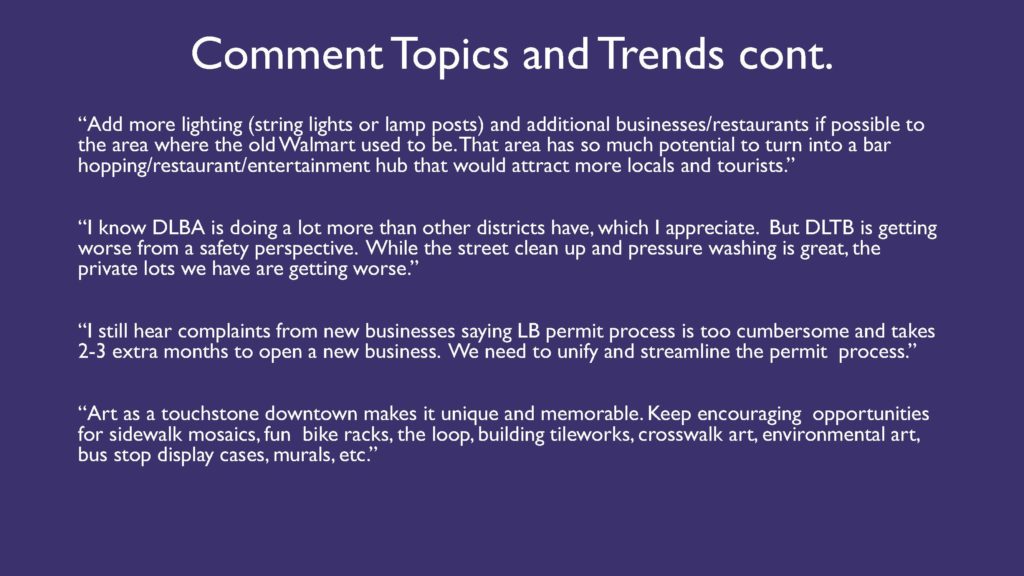
• Selected comments.
• Summarized themes of comments.
• Selected comments.