 Each year for the last three years, the Downtown Long Beach Alliance distributes a public safety survey to all of those connected to Downtown – residents, workers, business and property owners, as well as community groups and tourists. In total, the public safety survey is sent to over 10,000 individuals. The DLBA’s Public Safety Survey is intended to measure perceptions and attitudes regarding a number of safety issues Downtown. Because perception is based off individual experiences and observations, the results found in this survey do not necessarily reflect any statistics or empirical evidence regarding the same topic.
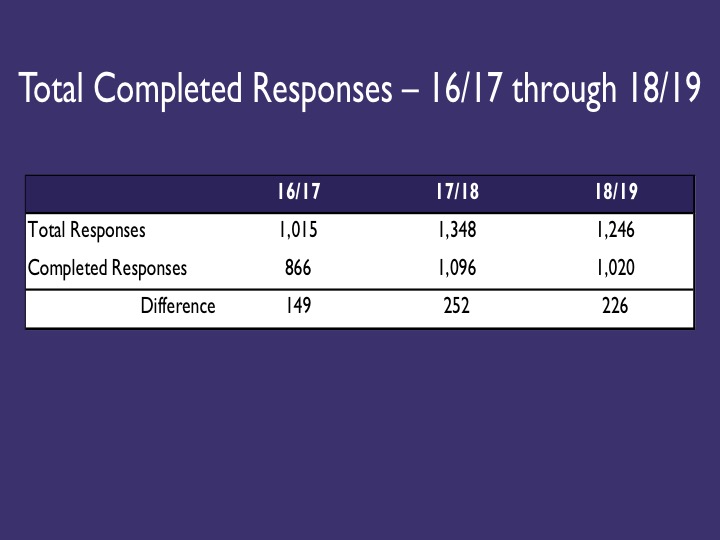
This year, the DLBA received 1,020 completed responses over the course of two weeks in Mid-April. The observations below are based on their responses.
 Slide 1: Total Completed Responses 16/17 through 18/19
This year a larger proportion of survey recipients took the survey and 81% completed it. This completion rate is the same as 2018 and down by 4% from 2017.
 Slide 2: 18/19 Responses by Relation to Downtown
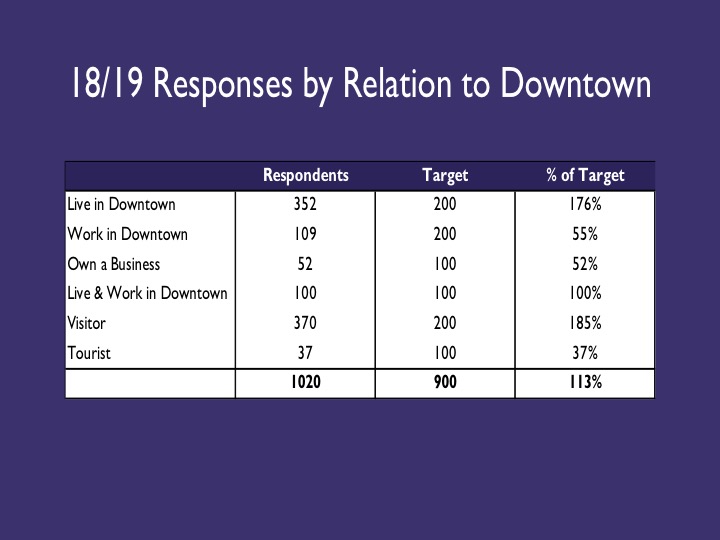
Each year the DLBA sets targets for the number of participants from each identified stakeholder group with the goal of ensuring all groups are engaged and represented. This year, survey participation was below target for those who work downtown, own a business, and tourists. Conversely, participation by Downtown Visitors and Downtown Residents was significantly above target. This is important to take note of because the perceptions of high participating groups are more represented in the survey results.
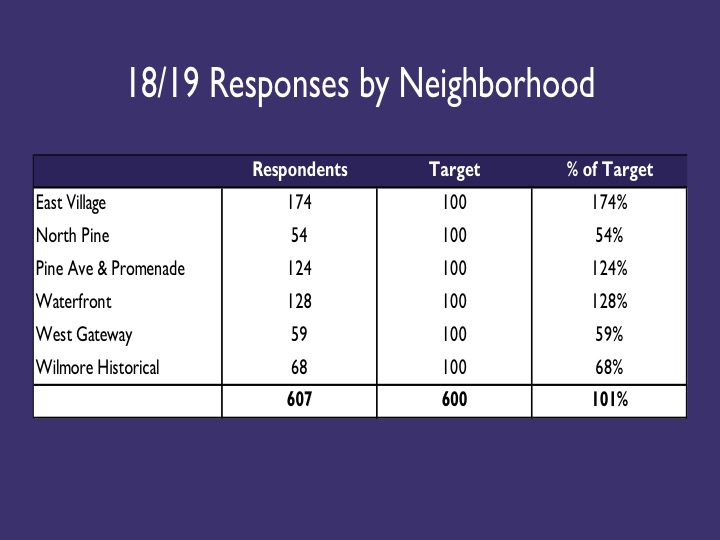
Slide 3: 18/19 Responses by Neighborhood
Survey participation was below target for Downtown neighborhoods such as West Gateway, Wilmore, and North Pine neighborhoods and above target for Pine and Promenade, The Waterfront, and East Village.
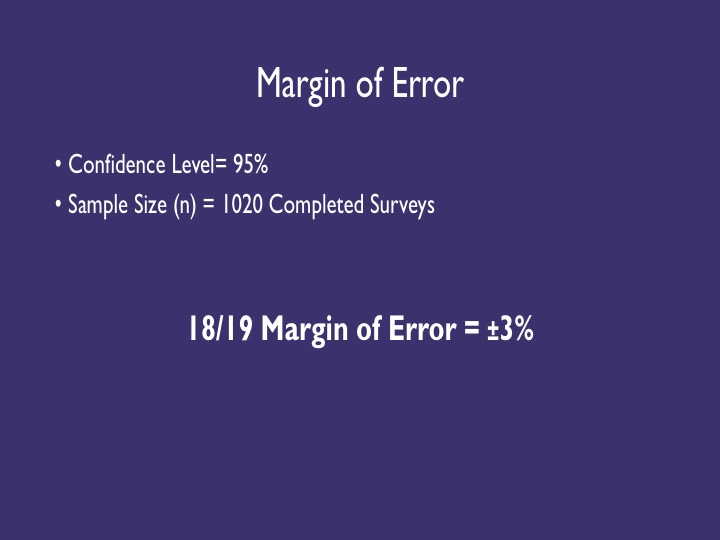
Slide 4: Margin of Error
A margin of error refers to the reliability of survey data. The question is, if the survey were conducted multiple times, would the same results be observed every time?
Based on the number of completed surveys, 95 times out of 100 the survey will deliver results that are within 3% of the correct statistic reading.
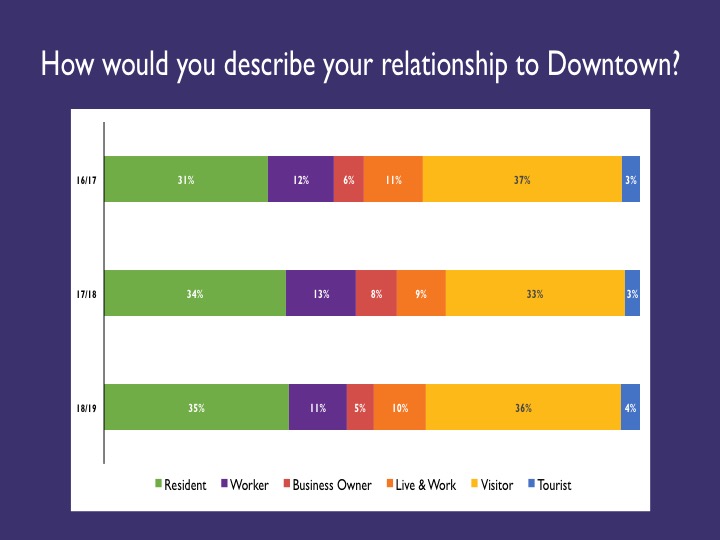
Slide 5: How would you describe your relationship to Downtown?
Same as slide 2 This year survey participation for those who work downtown, own a business, and tourists was below target. Conversely, participation by Downtown Visitors and Downtown Residents was significantly above target. This is important to take note of because the perceptions of high participating groups are more represented in the survey results.
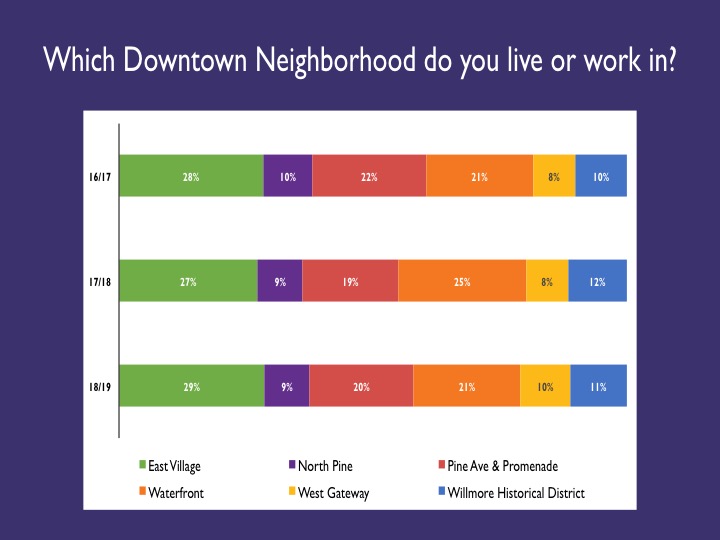
Slide 6: Which Downtown Neighborhood do you live or work in?
Same as slide 3 Survey participation was below target for West Gateway, Wilmore, and North Pine neighborhoods and above target for Pine and Promenade, The Waterfront, and East Village.
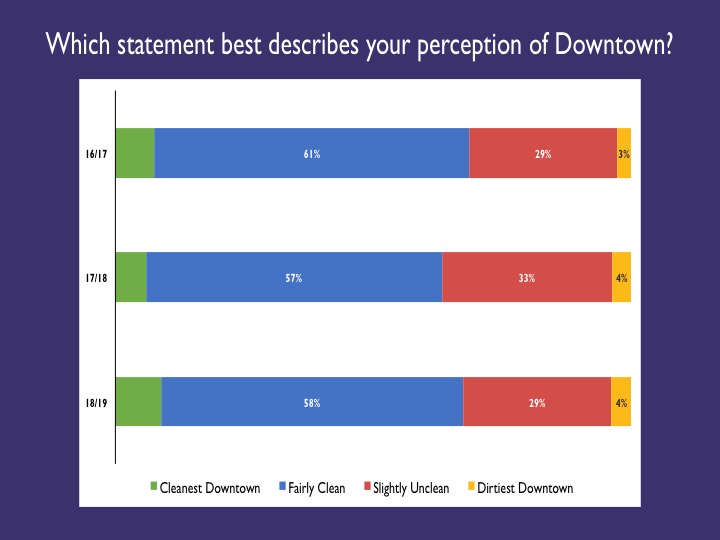
Slide 7: Which statement best describes your perception of Downtown?
This year, a higher number of participants felt that Downtown Long Beach was the cleanest downtown they have visited. There was also an increase from last year in those who answered that Downtown is “fairly clean”. There was a decrease from last year in those who rated downtown as “slightly unclean”. Overall, roughly 2 out of 3 people surveyed across 3 years responded that Downtown was clean or the cleanest downtown they had ever seen. While there will continue to be opportunities for improvement, the results indicate that investment in clean programs are having an overall positive impact on public perception of Downtown Long Beach.
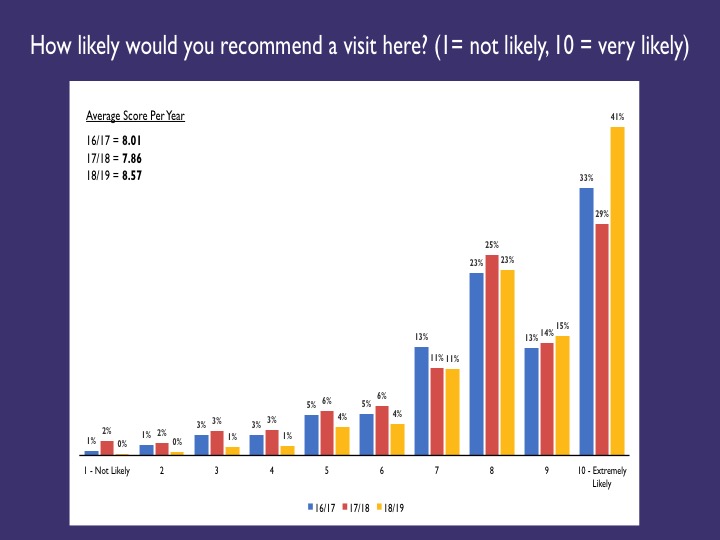
Slide 8: How likely would you recommend a visit here? (1= not likely, 10 = very likely)
Visitors play an important role in the economic vitality of Downtown. This year there was a significant increase in the number of people who were “extremely likely” to recommend Downtown Long Beach to others. The average score was 8.57 out of 10, which is also an increase over previous years. It is anticipated that as perceptions of Downtown Long Beach continue to improve and be shared, so too will the number of visitors to Downtown.
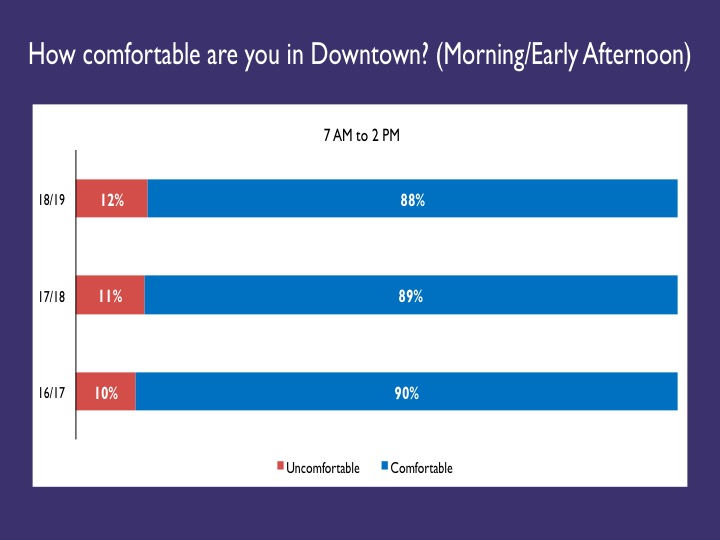
Slide 9: How comfortable are you in Downtown? (Morning/Early Afternoon)
The perception of safety downtown is important for informing the strategy of the DLBA Clean and Safe team in addition to that of partners such as the Long Beach Police Department. This set of questions gathered public perception on general comfortability in and around Downtown at different times of day. From 7am to 2pm 88% of people surveyed said they felt comfortable in Downtown Long Beach, 1% lower than previous years but within the 3+/- margin of error.
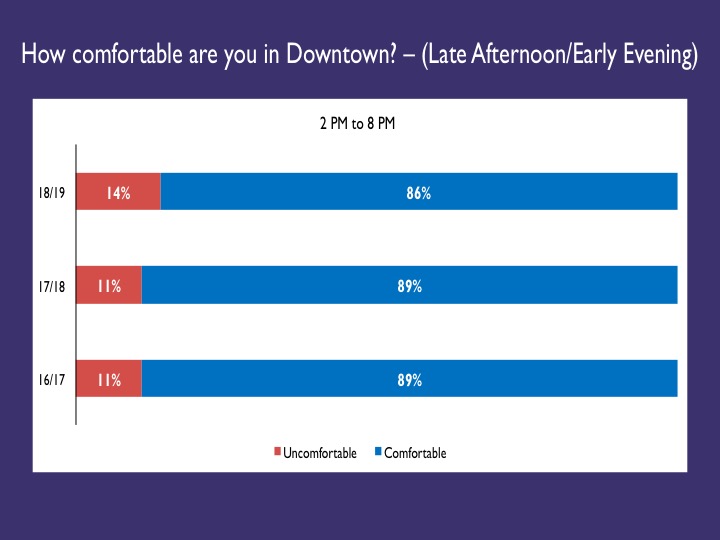
Slide 10: How comfortable are you in Downtown? – (Late Afternoon/Early Evening)
Similar to the last slide, approximately 86% of people surveyed said they felt comfortable in Downtown Long Beach between 2pm and 8pm. While this is an exceedingly a high number, it’s 3% lower than the two previous years which indicates a need to delve further into the factors impacting perceived safety Downtown.
*Bar graphs that do not sum to 100% are due to a proportion of people who responded as “n/a” because they were not present in Downtown at that time of day.
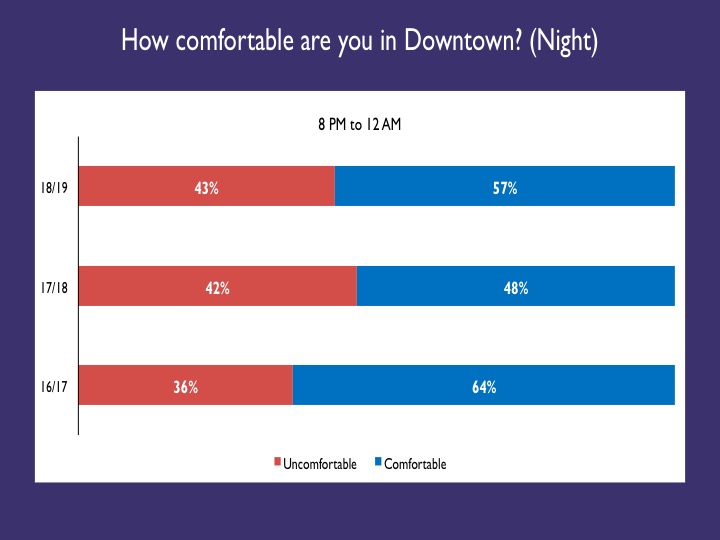
Slide 11: How comfortable are you in Downtown? (Night)
Similar to previous years, a significantly smaller proportion of those surveyed felt “fairly/completely comfortable” during the nighttime and early morning hours. Across 3 years, roughly 40% of those surveyed felt uncomfortable from 8pm to 12am.
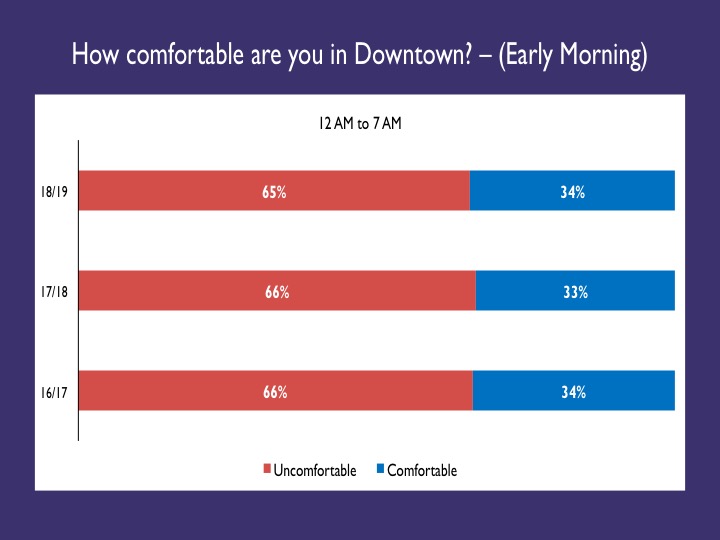
Slide 12: How comfortable are you in Downtown? (Early Morning)
Approximately 2 out of 3 of people surveyed said they felt uncomfortable in Downtown Long Beach between 12am and 7am. This has remained consistent over the past 3 years. Future slides identify some of the areas of improvement identified by survey participants.
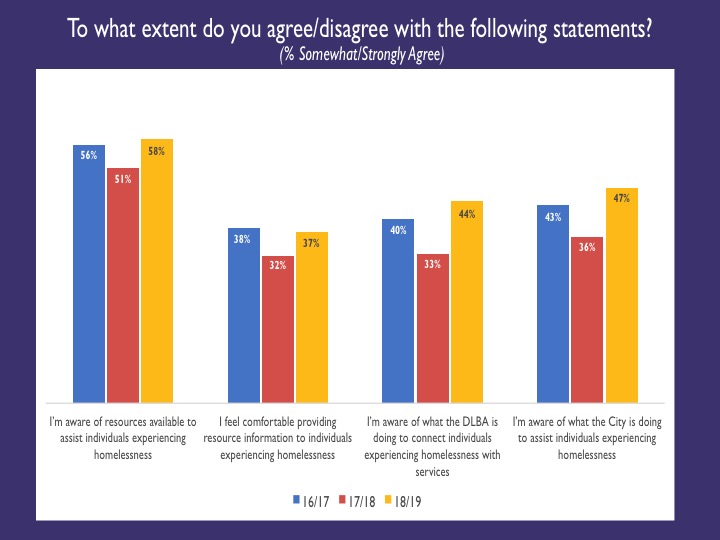
Slide 13: To what extent do you agree/disagree with the following statements?
Homeless Resources
This slide represents the proportion of people who agreed with the statements concerning homelessness and the availability of resources. We see a positive increase across the board in awareness of homeless resources offered by the DLBA, the city, and even by community stakeholders.
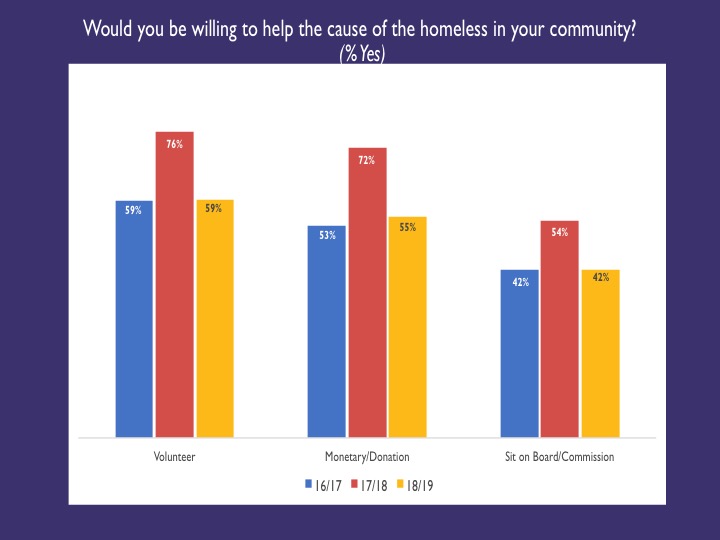
Slide 14: Would you be willing to help the cause of the homeless in your community?
Overall, about 50% of those surveyed in 2018/19 said they would be willing to volunteer, offer financial support, or sit on boards and commissions concerning homelessness. The proportion of people who said they would be willing to help the cause of the homeless in their community spiked significantly in 2017/2018, with 16/17 levels being roughly the same as 2018/2019.
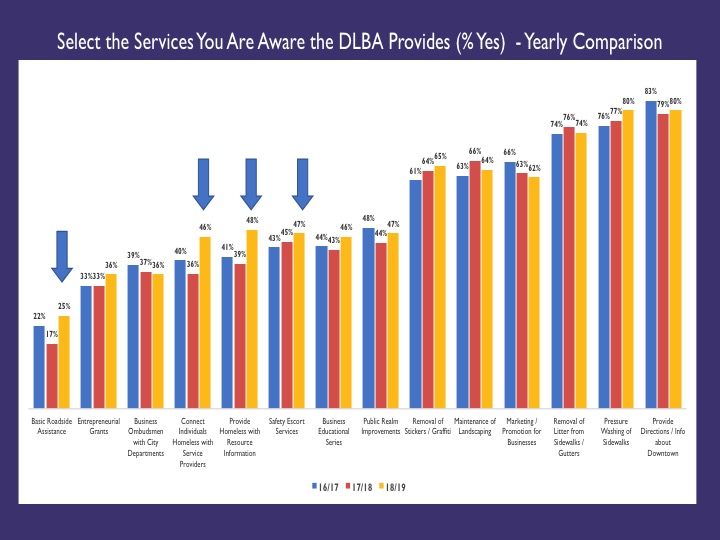
Slide 15: Select the Services You Are Aware the DLBA Provides (% Yes)
The DLBA has made a concerted effort to promote services offered to stakeholders, and that can be seen through the trending increases in awareness of almost all services offered. Notably, awareness of services concerning homelessness have increased between 6 and 7% over three years, and lesser known areas such as basic roadside assistance and economic development grants/education have increased. In addition, there is consistent high awareness of the DLBA’s flagship services.
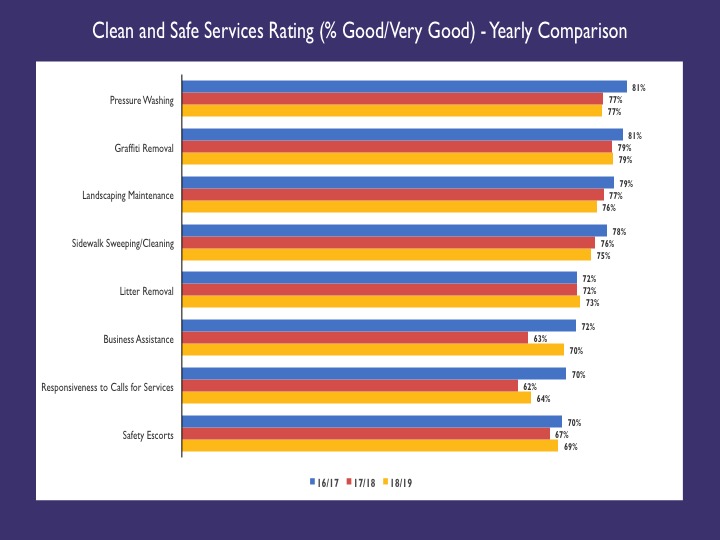
Slide 16: Clean and Safe Services Rating
This slide reflects the proportion of people who rated Clean & Safe services as being “good” or “very good”. Despite any year-to-year fluctuations, there were consistently high ratings for services offered. However, perceptions of responsiveness to calls for services has fallen 6% over three years.
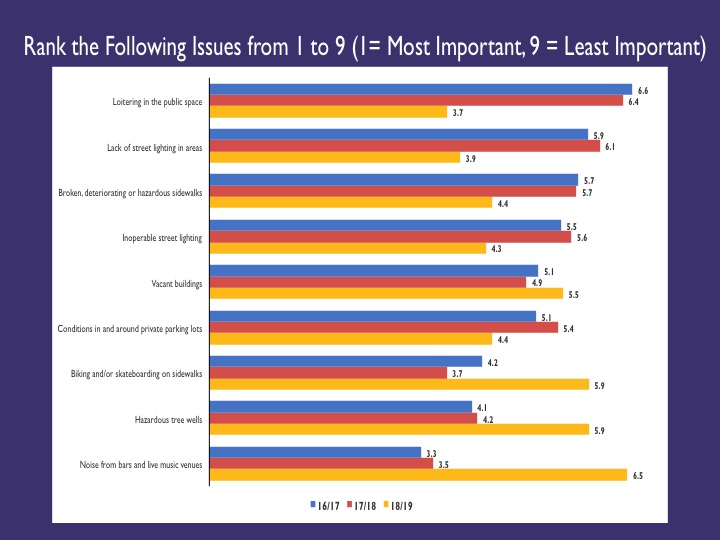
Slide 17: Rank the Following Issues from 1 to 9 (1= Most Important, 9 = Least Important)
This question asked participants to rank issues from most important to least important on a 1-9 scale, 9 being least important. Over three years, “loitering in public space” has increased significantly in priority as an issue. This is also the case with street lighting and broken sidewalks. On the other hand, biking/skateboarding on sidewalks, hazardous tree wells, and noise from nightlife has moved down in priority significantly. These results provide important insights on the evolving priorities of Downtown stakeholders and visitors.
For questions related to the survey, please contact DLBA at (562) 436-4259 or info@dlba.org.